Styles determine how a map looks when viewed, printed, embedded in a map layout, or exported to any style-conscious format (such as Adobe Illustrator or KML).
Cartographica has a sophisticated style system which provides significant control over how data is shown on the screen and in printed output.
Styles are assigned and manipulated for each layer individually.
Opening the Style Editor
To bring up the Style Editor for any layer, use one of the following techniques:
Select the desired layer in the Layer Stack
Open the Style Editor:
Double-click on the layer to open the Style Editor
Click on the button at the bottom of the Layer Stack to open the Style Editor
Choose >
At this point, you should have an appropriate Style Editor Window visible.
Styles in Cartographica are a very powerful mechanism for changing the presentation of your map. By using the values of data in the features, Cartographica can create thematic maps without requiring manual intervention in every step of the process.
When Cartographica prepares to draw a particular feature, it first evaluates the style, as defined in the layer's Style Window, to determine if the feature qualifies for a particular style variation, or if it is to be drawn with the Default Style. For layers where you desire all features in the layer to look the same, use only the default style and all features will be drawn the same.
Vector styles share many traits, although each different type of feature (lines, polygons, and points) have some unique attributes and slight variations in how the standard attributes are applied.
For all style manipulation, work begins in the Style Window.
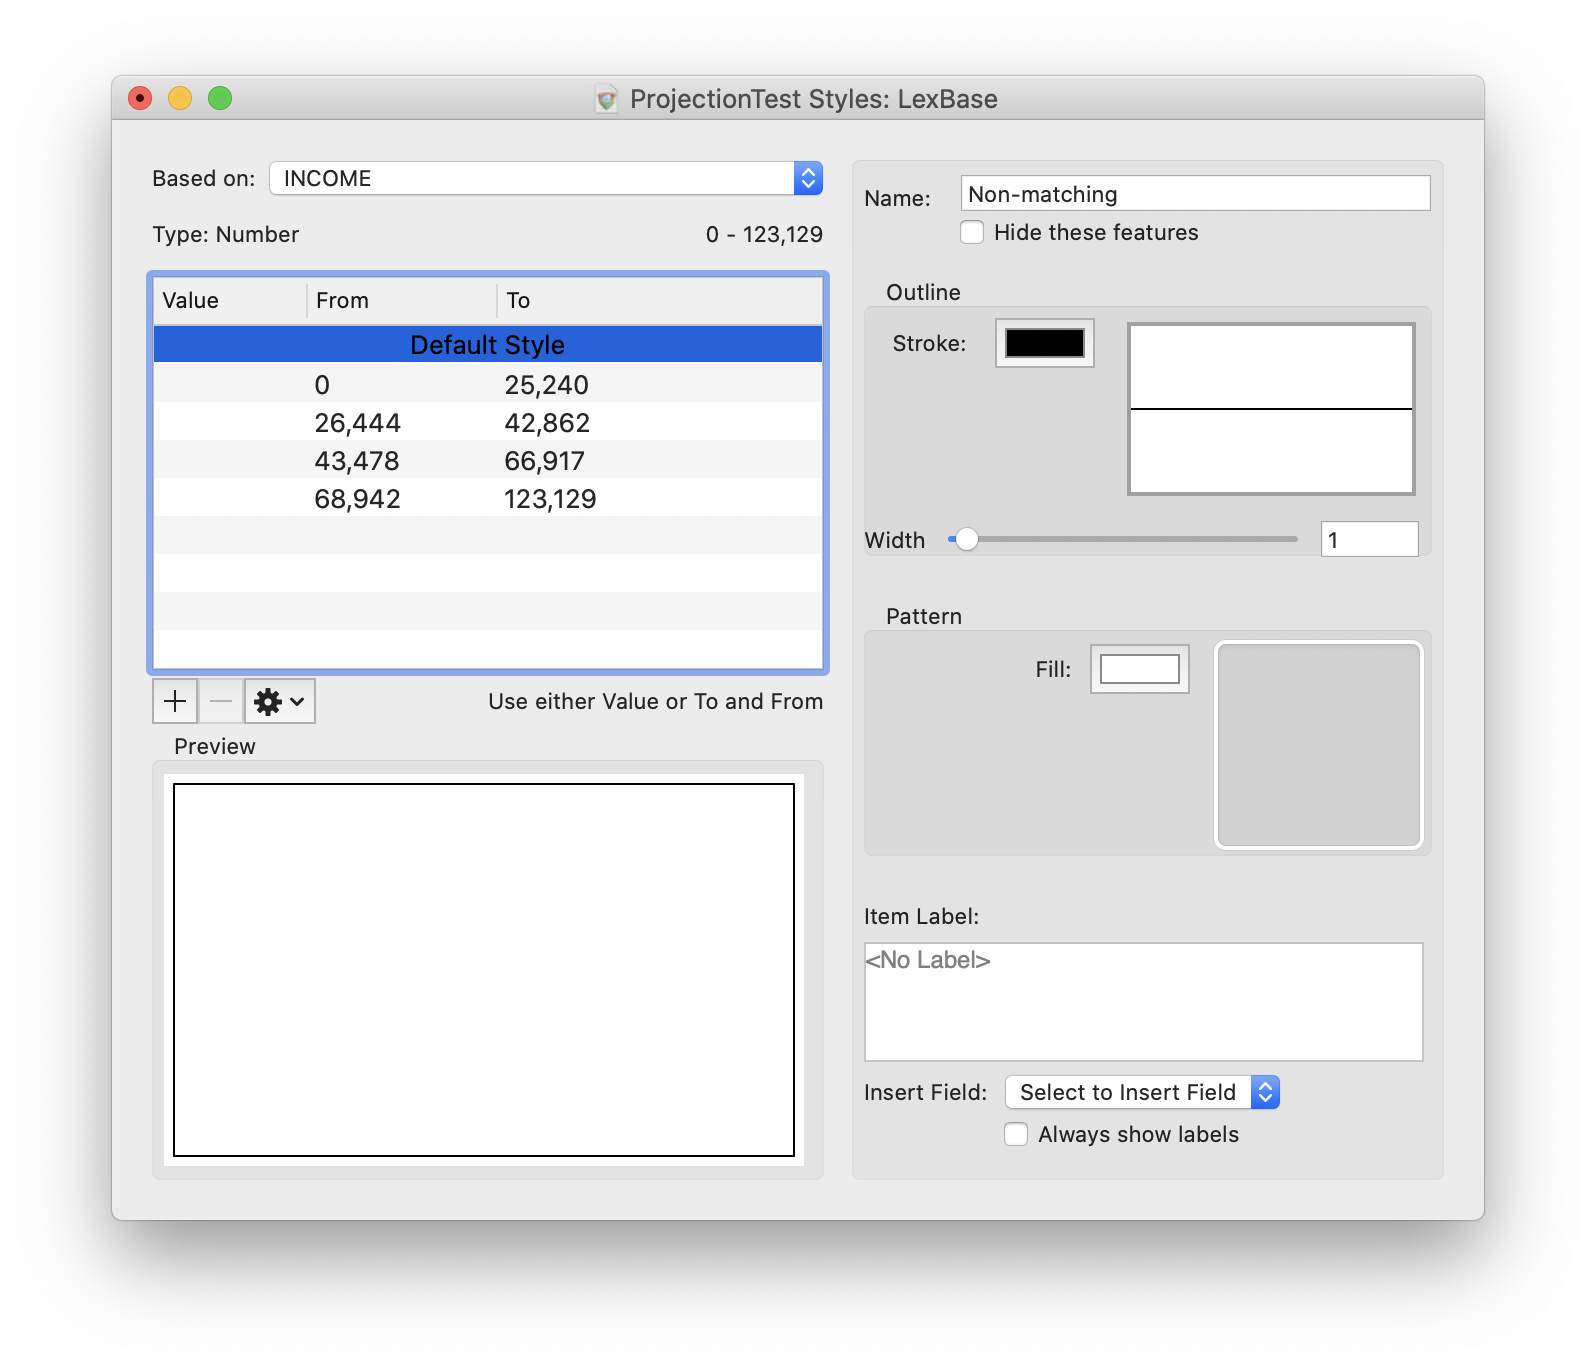
The style window is divided into three primary areas:
The upper left portion of the window contains the Style List, which is used to discriminate between styles in a style set. All layer styles can either be comprised of a single style (in this case, referred to as the Default Style) or multiple styles. This will be covered later in Section 6.1.5, “Complex Styles”.
The right side of the window is the Appearance pane and it determines how each feature in a particular style looks. This includes the label, marker, lines, colors, and naming.
The lower left portion of the window is a Preview of the style you are currently working on. In the case of multi-style style sets, the selection in the Style List determines which style is shown in the Preview.
Since many of the elements of the Appearance pane are common to every feature type, we will examine what each element represents and how it is used, going from the top to the bottom.
Name is used in the Map Legend and other areas of the software to represent this particular style in a style set. The contents of this field are used as the name of the style in the legend, when multiple styles are shown. If you leave the Name field empty, Cartographica will create defaults based on the values that comprise the style's range.
The color wells are used to adjust the color of individual elements. Their use varies based on the type of features represented by the layer, and by the element that is being styled. Color wells function as drop targets and bring up the color picker when they are clicked on, allowing you to choose colors using the standard mechanisms available to all Macintosh software.
Size fields are denoted by a slider and a text area and allow you to change size parameters, such as line width, pattern size, or symbol size. The slider and the box both provide the same control, and you can use them interchangably.
Item Label and Insert Field menus are used to determine what text should be placed next to the point, along the line, or inside the area. You can add text to the label by typing into the box, and references to fields can be added by placing the cursor where you want the field and then using the Insert Field pop-up menu to select the field you want added. A field marker (with the name of the field inside of a colored cell) will be placed at the cursor location. This is covered in depth in Section 6.1.4, “Labeling Features”
Always show labels determines if labels are always shown for this particular style, or whether the system should determine whether they should be visible or not. Generally, you should leave this unchecked for most styles, but if you have features whose labels you always want displayed, this box provides allows you to override that.
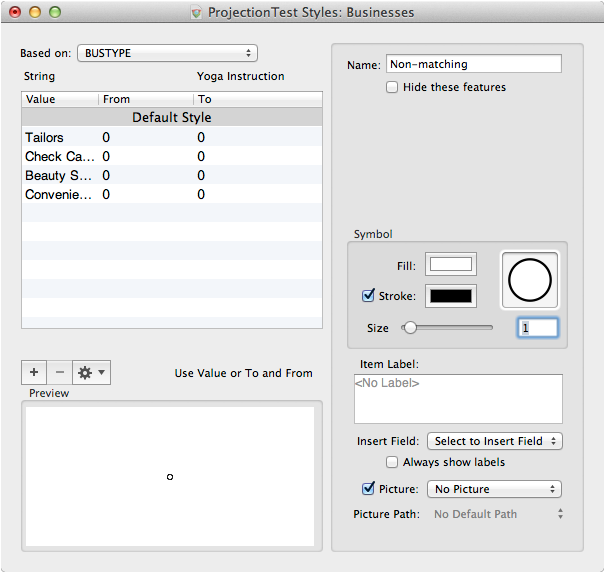
Symbol, Picture, and Picture Path are only available when editing Point features, and so they will be covered in Section 6.1.1, “Point Styles”.
Point styles can be customized in many ways. The Size slider and box control the total size of the point item. Due to variations in particular symbol drawing techniques and different visual weights (which affect apparent size), it is often the case that symbols with the same size are similar, but not identical in size or area. This is to be expected. We have tried to keep the sizes consistent for all symbols created directly inside of Cartographica, but you may need to balance sizes a bit, especially when using custom picture- or font-based symbols or when using symbols of greatly differing weights.
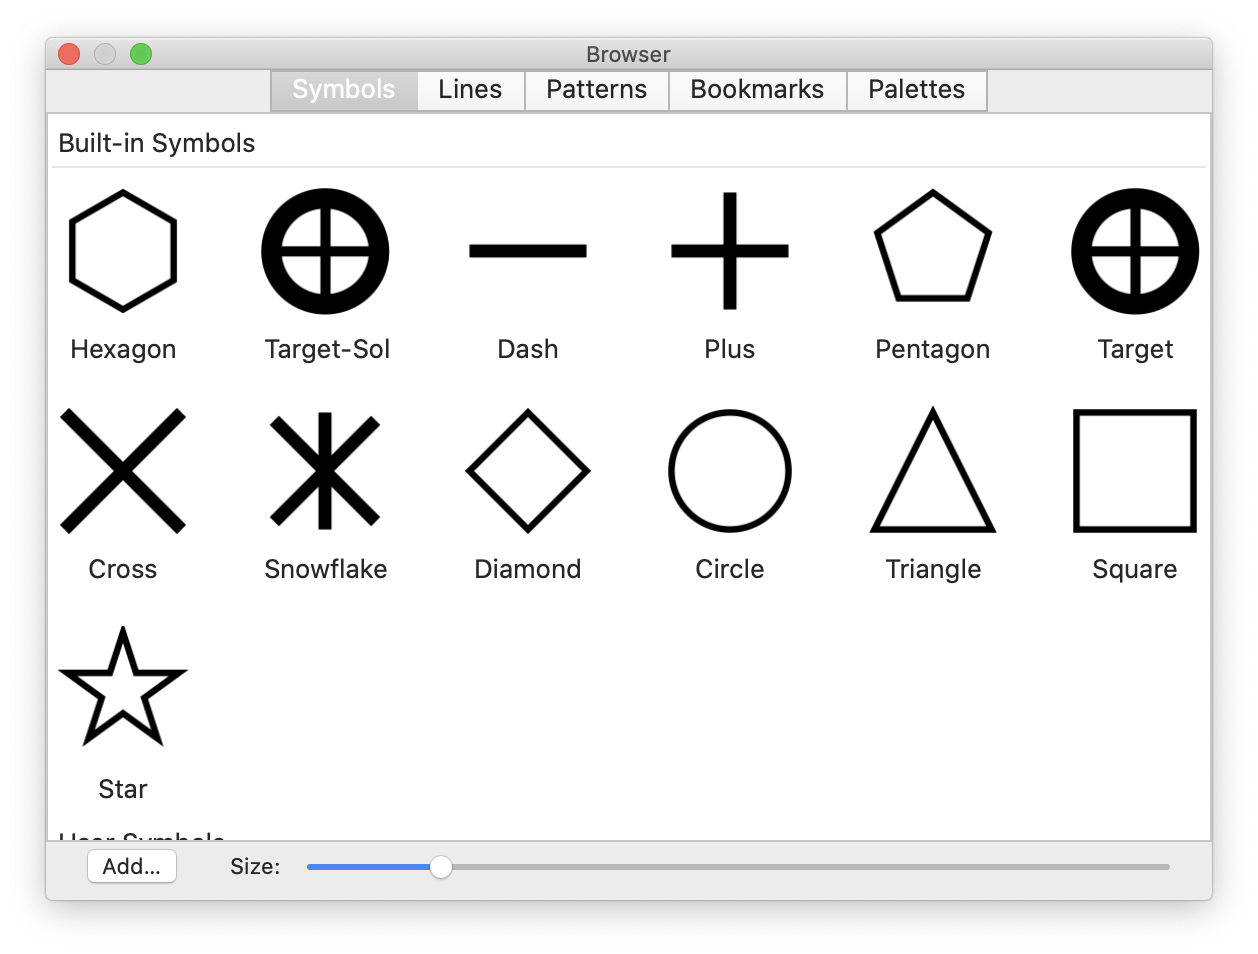
For most Point symbols, the Stroke box and color well determine if the outline of the symbol is visible and the color of the symbol outline. Not surprisingly, the Fill color well determines the color which fills in the symbol. For some symbols, there is no "fill" area, and therefore the symbol's fill color does not matter and the stroke must be present for the symbol to draw. Examples of these in the built-in symbols are the cross and plus.
Although Cartographica may not ship with the variety of symbols of some other programs, the ability to import high-resolution symbols from a variety of places makes up for many missing symbols. To change a symbol, the Symbol Well is used as the dropping point for one of a variety of sources:
The Symbols Browser window, which is the built-in repository for scalable symbols (pictured in Figure 6.3, “Symbol Browser Window”), contains a number of common symbols for use on maps which are simple, but highly scalable.
Images from a variety of sources. Basically any image that you can get onto your Macintosh is usable as a symbol in Cartographica. This can be a graphic from a web page, something designed in illustrator, or a licensed piece of clip-art. When an image symbol is used, Cartographica pays attention to the alpha channel for transparency, meaning that transparent-capable formats such as PNG are more desirable than JPEGs, as an example.
![[Note]](Graphics/note.svg)
When using images as symbols, the Stroke and Fill colors can seem to behave oddly. This is because, when checked, the Stroke will color anywhere in the image that is not transparent, and the Fill will not be used. For graphics that have transparency, this can have the desirable effect of being able to color the parts of the image with color. However, for graphics that contain black and while colors (for example), it has the surprising effect of coloring the entire symbol (white and black) with the stroke color. To turn off the color manipulation, just uncheck Stroke.
The Macintosh Character Viewer. The Character Viewer is a standard part of OS X, which is made visible on the screen by checking the Show Keyboard & Character Viewer in menu bar option in the Keyboard preferences panel in System Preferences. Once this box is checked, you can bring up the window by choosing Show Character Viewer from the menu bar. Any character from the palette can be made into a Cartographica symbol just by dragging it into the Symbol Well. Among the available symbols in many standard fonts are: airplane, a variety of stars, and many more. Plus, cartographic symbol fonts are also available from a variety of commercial and non-commercial providers.
Stylized text from any window. Although single-characters are often enough and our labeling system provides ample opportunity to provide static and variable text labeling, text from any window can also be used as a "symbol" for a point.
Besides symbols, Cartographica can also represent points with a picture stored on disk by using the Picture check box and field selector and optionally the Picture Path to specify the location of the referenced pictures. When using a picture to represent the points on the map, the Picture box must be selected and a field must be chosen in the pop-up menu. The picture field designates which column contains the file name of the referenced file, which can be a full or partial path name. A partial path name is resolved first by looking at the Picture Path and then by using the directory the layer (or map set for an internally-stored layer) is saved in as the default. When using a picture symbol, the Image Viewer will come up whenever a represented point is selected, showing a larger version of the picture (or a playable version of the movie, if the referenced data is a movie file).
Labels may also be added to point features, see Section 6.1.4, “Labeling Features” for further information.
Setting the Symbol for a Point layer
Open the Style Editor for the desired layer
Click once in the Symbol well in order to bring up the Symbol Browser Window.
Choose a symbol from the Symbol Browser Window and drag it to the Symbolwell
Adjust Point Size,Stroke, and Fill as desired
Using a Font Character as a Symbol for a Point Layer
Open the Style Editor for the desired layer
Bring up a window containing the font character. Commonly this is done with the Show Character Viewer item from the menu bar (if you can't find it, you may need to turn it on in the Keyboard System Preferences
Choose a symbol from the character viewer or other window and drag it to the Symbolwell
Adjust Point Size,Stroke, and Fill as desired
Using an Image File as a Symbol for a Point Layer
Open the Style Editor for the desired layer
Bring up a Finder window containing the symbol file
The file should be one of the standard image types understood by the MacOS X, such as: PDF, Adobe Illustrator, GIF, JPEG, PNG, etc.
Drag the file to the Symbolwell
Adjust Point Size,Stroke, and Fill as desired
The effect of the Stroke and Fill on image symbols can be a bit strange. Generally, you will want to use the Stroke box and color only if you want to completely fill the symbol with the stroke color.
Using Pictures as a symbol
Before using pictures as a symbol, you must make sure that you have the picture files in a format that MacOS X understands, such as JPEG, GIF, or PNG. You must also know where those files are in relation to the Picture Path or the layer data.
These instructions assume that you already know where the pictures are and have a column that contains the partial or full path names to the picture files.
Open the Style Editor for the desired layer
Select the name of the column with the paths by using the Picture pop-up
If your photos are referred to by partial path names, you may need to select the Picture Path by using the pop-up menu
If you would like the pictures to show up in the map as the Point symbol, make sure the Picture box is checked
To change the size of the displayed picture on the map, use the Point Size slider or box.
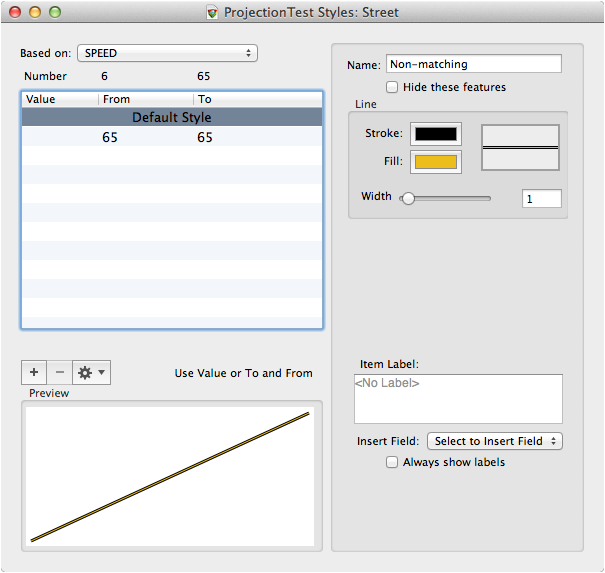
Line styles can be used to change the visual aspects of lines on a map. Some of the components for line styles should now be familiar to you, based on the point styles, but lines have some additional attributes.
Line styles are based on a line style template, which are dropped into the line style well in order to assign them to a style. In the example shown below, the Default Style for this line contains a line with thin black strokes, and a yellow fill. Not all lines will have both parameters, however they should all have a Stroke color, so that you can change the overall color of the line style. In some special cases, there are colors in the style that are not able to be changed through this window. If you are using one of these styles and find the need to change the color, look for another line style in the Lines tab of the Uber Browser.
The Width determines the width of the line, and in the case of a stroked line, the width of the stroke as well. The two are proportionate, and therefore the width is a scaling factor that operates equally on each of the components of the line.
Setting the Line Style
Open the Style Editor for the desired layer
Click on the line style well next to the color wells
The Uber Browser will appear with the Lines tab selected.
Choose a line style from and drag it to the line style well
The line style should change in the well, the preview, and on the map to reflect your choice.
Adjust Size,Stroke, and Fill as desired
Polygon styles can be used to change the coloring, pattern, outline style, and labeling of polygon features on the map. You can leverage much of your knowledge from the line and point styles to use the polygon style window. In fact, the window is even set up to reflect this, with the Outline box in the top position (where the Line box appears for lines), and the Pattern box in the lower position (where the symbol box appears for poings).
When a polygon is drawn, Cartographica uses the Outline information to draw the outline of the polygon, and the Pattern information to fill in the inside of the polygon.
The patterns in Cartographica work similarly to the Symbols in point layers. There are certain pre-defined patterns that come with Cartographica, and they are made up of black and transparent data, so that they can be scaled and colored easily. However, you can also use just about any image (including symbols from the symbol tab) as fill for polygon layers.
When a pattern is not in use, the pattern well is empty (as is shown below), and there is a Fill color well to determine the solid fill color to be used. When patterns are used, the pattern will appear in the pattern well and Stroke and Size controls will be added, to control the color of the stroke, and the pattern size, respectively.
Setting an invisible line style
Sometimes it's necessary to have a polygon with no outer edge. In this case, you will need to remove the line to prevent it from drawing.
Open the Style Editor for the desired layer
Click on the line style well next to the color wells
The Uber Browser will appear with the Lines tab selected. (This can be ignored for now)
Switch back to the style window
You should find that the line style well is highlighted, indicating it has keyboard focus
Use the delete key on the keyboard to remove the line style
The line style should disappear from the well, the preview, and on the map to reflect your choice.
Setting an invisible fill color
Sometimes it's necessary to have a polygon with no visible fill color. In this case, you need to remove any pattern and set the fill color to transparent.
Open the Style Editor for the desired layer
Click on the pattern well next to the fill box
The Uber Browser will appear with the Patterns tab selected. (This can be ignored for now)
Switch back to the style window
You should find that the pattern well is highlighted, indicating it has keyboard focus
Use the delete key on the keyboard to remove the line style
Any pattern will disappear from the well, the preview, and on the map to reflect your choice.
Click on the Fill color well to select the fill color and bring up the Color window
Use the opacity slider to set the opacity of the fill color to 0%.
The well will be filled with a triangular symbol signifying you have a transparent color and color will disappear from the preview, and on the map to reflect your choice.
Using an Image File as a Fill Pattern
When Cartographica doesn't have the fill pattern that you need, you can specify the fill pattern using a file. That file will be automatically tiled by Cartographica to fill the area.
Bring up a Finder window containing the image file for your pattern
The file should be one of the standard image types understood by the MacOS X, such as: PDF, Adobe Illustrator, GIF, JPEG, PNG, etc. For best results for scaling, you will likely want to use a PDF file, although images will also tile.
Drag the file icon to the Fill well
Adjust the Size, Stroke, and Fill as desired
The result of the Stroke and Fill on image fills can be a bit strange. Generally, you will want to use the Stroke box and color only if you want to completely fill the symbol with the stroke color.
Use the delete key on the keyboard to remove the line style
Any pattern will disappear from the well, the preview, and on the map to reflect your choice.
Click on the Fill color well to select the fill color and bring up the Color window
Use the opacity slider to set the opacity of the fill color to 0%.
The well will be filled with a triangular symbol signifying you have a transparent color and color will disappear from the preview, and on the map to reflect your choice.
All styles can be labeled, providing a way to indicate the name or other attributes of a feature on the map.
Labels are among the most complex options in Cartographica due especially to the need to avoid clutter and collision when items are placed near each other. Although the particular algorithm cannot be described in detail and is subject to some amount of change, here are some important points to understand about how Cartographica handles labels:
All labels are drawn after all features are drawn and therefore labels show up "on top" of all features, including those features above the features that are being labeled. This prevents problems such as the label for a State (usually a polygon layer) being occluded by the point and label for a city in that state (usually a point layer positioned above the polygon layer so that the features are visible).
Labels are evaluated in layer order, which is to say that the labels of layers at the bottom of the layer stack have a higher priority than those at the top of the stack.
Within a layer, labels are evaluated in draw order, which is really not deterministic, and therefore there is not a good way to tell which labels in a layer will be drawn a priori.
The best way to control labels is to only turn them on for items that are important for display purposes. This can be achieved by using a Complex Style (see Section 6.1.5, “Complex Styles”) to separate the labeled and unlabeled items.
When necessary, very complex labels can be made by using a Calculated Column (see Chapter 13, Column Formulas) to create the contents of the field and referencing that calculated field in the label.
Labels can have multiple lines, which are added by inserting a return in the Item Label box.
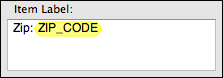
Labels are controlled by the content of the Item Label box, shown in close-up in Figure 6.6, “Label field”. Labels can contain text and fields and can be styles using one or more fonts and sizes. The example shown here is a simple label containing introductory text "Zip:" and the contents of the ZIP_CODE field. In the Item Label box, the contents of a field are represented by a Field Marker, which is the name of the field surrounded by a colored oval.
Field Markers may be moved around through drag and drop and may be copied, pasted, and deleted.
So far, we have been describing simple styles, which apply identically to every feature in a layer. However, it is often the case that some features in a layer deserve special attention. Examples of this include a layer that contains cities, some of which are state or country capitals, or a layer of roads that contains both local roads and large highways. In each of these cases, some of the features in the layer are singled out for special attention.
Complex Styles are also used when attempting to show quantitative or qualitative attribute information graphically. For example, a polygon layer representing states could be colored differently based on population; similarly, the size of a city symbol in a point layer could vary based on population.
There are three primary controls for complex styles: the Based on: pop-up menu, which is used to determine which field is used to discriminate between the styles; the style list on the left side of the window above the Preview box, which displays the list of defined styles and provides for addition, deletion, etc.; and the Hide features that don't match check box, which determines whether the Default Style is used.
In complex styles, the Based on: pop-up menu determines which column of data is to be used for discriminating between the styles. Once the column is selected, use the table on the left of the window to determine the breaks for each style variant.
When using a string column to discriminate, you must use the Value column, which indicates an exact match between the value in the column and the one you define in the style here. When using a numeric column to discriminate, you may use either the Value column or the From and To columns. For the Value column, the data must still match exactly. When using the From and To columns, the value must be within the range specified. The Distribute button may be used to help create natural ranges based on a linear distribution over the range of the data in the selected layer.
Under Based on are 3 pieces of data that appear when a column name is selected. These are the field type (string, number, date), and the minimum and maximum values.
The table in the left of the window lists the values or ranges for each style in the style set. To change the appearance of the style, select it in the table at the left and then adjust the parameters on the right, using the techniques described previously for each feature type.
You may also select multiple styles at the same time, allowing simultaneous editing of items. This is useful, for example, when using different symbols, but wanting to change the size for each of them. In this case, select the desired styles and then change the size. The size will change, but the remainder of the appearance will remain unchanged.
Styles are added to the list by using the and buttons, or by > or > . The button adds a new style by copying the default style. Each of the menu items provides a way to add an identical copy of the selected style to the list, with the also increasing the From and To values.
When using quantitative information to discriminate between styles, it is often beneficial to have Cartographica assign breaks between the styles. The gear menu provides access to these functions, as outlined below:
: distributes the values of the Based On: field across all of the styles in the style list. For example, if the values range from 0-100 and you have 4 styles currently in the list, those styles are changed to range from 0-24,25-49,50-74, and 75-100 respectively. No other changes are made to the styles and the number of styles are not changed.
: distributes the values of the Based On: field using the Jenks natural breaks distribution method. This method will calculate the natural breaks that occur in the data set, based on attempting to determine where clusters of values exist. No other changes are made to the styles and the number of styles are not changed.
Distribute With Equal Count: distributes the values of the Based On: field by making each range contain an equal number of features. This is done using an increasing value, so the ranges will always be contiguous. For example: 5-10,11-20,21-30, etc.
Distribute With Equal Area (available only for polygon layers): distributes the values of the Based On: field by making each range contain an equal area on the map, in the current CRS. This is done using an increasing value, so the ranges will always be contiguous.
Distribute With Quartile Distribution: distributes the values of the Based On: field into four (4) groups by making each range contain an equal number of features. This is done using an increasing value, so the ranges will always be contiguous. When applied to a style set, any existing styles will be used up to the fourth one, and all styles beyond the fourth will be removed.
Distribute With Quintile Distribution: distributes the values of the Based On: field into five (5) groups by making each range contain an equal number of features. This is done using an increasing value, so the ranges will always be contiguous. When applied to a style set, any existing styles will be used up to the fifth one, and all styles beyond the fifth will be removed.
Distribute Unique Values: distributes the values of the Based On: field into one group per value. This is mostly for use with string columns, although numeric columns with a small number of actual values can also be used. When applied to a style set, any existing styles will be used where possible, and all styles beyond those necessary will be removed.
All style information updates immediately, both in the preview window and in the map view, so the user should be able to drag the sliders and move around with the color picker until they have matched what they need.
Applying a palette of colors to a set of styles
It is often desirable to use a set of common colors for particular maps. Cartographica provides an easy way to take a color palette and apply it to the fill or stroke color of each element in a style list in turn. The result is a series of different colors, one for each style
Open the style window for the desired layer
Choose > and click the Palettes tab to bring up the Palettes Tab of the Uber Browser.
Choose a color palette and drag it to the style list, dropping it when the cursor changes to the add cursor.
To change the stroke color instead of the fill color, hold down the option key on the keyboard when you drop the palette
Temporarily disable all styles for a layer
This method disconnects the discrimination logic, leaving every feature in the layer at default. No other parameters are changed, so it can be used safely to "flatten" the appearance of a layer without actually changing it's style.
Open the style window for the desired layer
Change the Based On value to
None of the other settings for the style set will be changed by doing this, so you can change back to your previous style settings just by returning the Based On pop-up to its previous value.
Hiding Features
When using complex styles, there may be times where you want to remove items that match a particular criteria (or do not match any of the criteria) from the map. For this, Cartographica has the option to hide features which match a particular category.
Open the style window for the desired layer
Select an existing style (or create one from above) which you want matching features hidden
Features matching this style will be hidden from output.