For raster layers, the styling is much simpler than for vector layers. Since the raster layer often contains detailed color data, there is no real need for a complex system as with vectors.
For some raster layers, their content is a representation of data instead of imagery. In these cases, Cartographica can be used to visually color the raster layer based on the values of data in the layer.
For both of these cases, you can adjust the opacity of the layer so that it may be placed above another layer, mixing some of the contents of the underlying layer with the contents of the overlaid layer.
Although a number of color palettes are included with Cartographica, see Chapter 14, Color Palettes for more information about using and editing color palettes.
Adjusting a Raster Layer's opacity
Select the layer in the layer stack
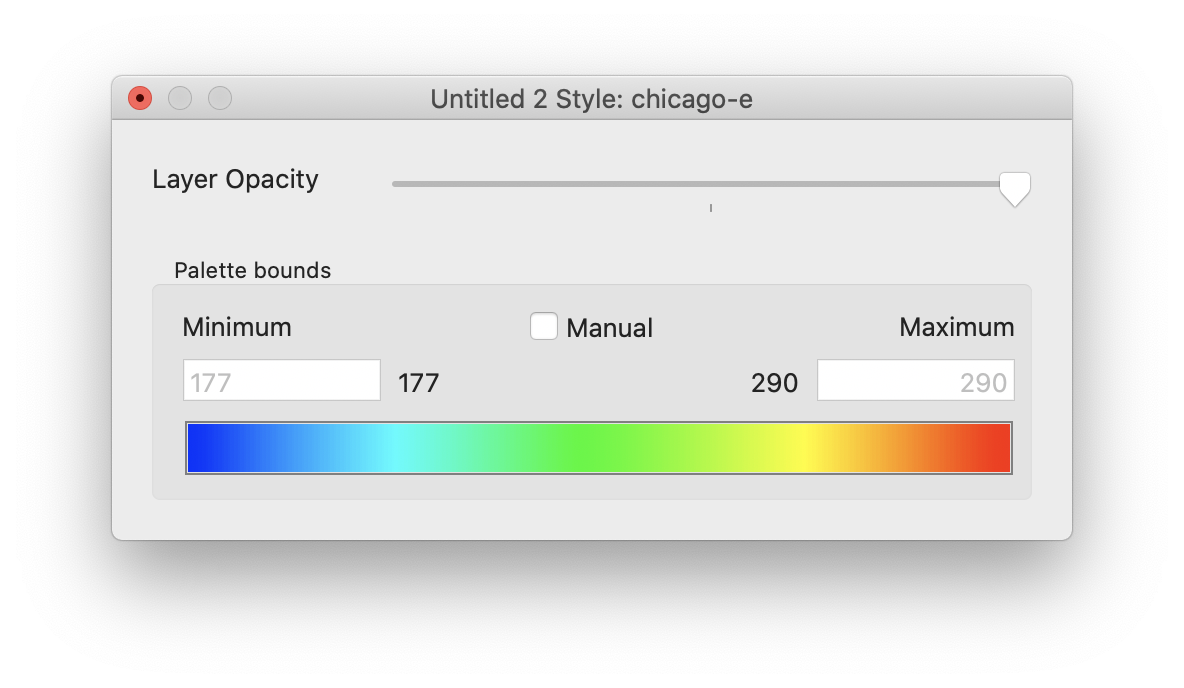
Choose > to bring up the Raster Layer Style Window for this layer.
Drag the Layer Opacity slider to the desired opacity
The layer on the Map will update as you do this
Close the Raster Layer Style Window
Changing a Raster Layer's palette
Select the layer in the layer stack
Choose > to bring up the Raster Layer Style Window for this layer.
Choose > and click the Palettes tab to bring up the Palettes Tab of the Uber Browser.
Select a new palette from the list and drag it to the Palette well in the Raster Layer Style Window
The layer color in the map should be updated immediately
Close the Raster Layer Style Window
![[Note]](Graphics/note.svg) | |
If you are working with a true-color image (one with component RGB), the palette well will not be available. |
In some cases, the entire range of the data is not useful for visualization. This can happen, for example when a data set contains mostly data in a small range, but has a few outlier data points that are the result of errors in data gathering. It can also happen when the interesting range is a small fraction of the total range of the data. Cartographica can visualize a smaller (or, in fact, larger) range of data values without having to modify the underlying data by constraining the application of the palette to a different range of values than those in the sample set. All values above the range and below the range are clamped to the highest and lowest values respectively.