When you initially open a Cartographica map the Map Window appears. Figure 2.2, “Main Cartographica window” shows that window with a map already loaded in it. This window is the centerpiece of Cartographica and where most of the work is done. In the figure we have shaded various sections of the window for purposes of explaining the layout and function of each of the sections.
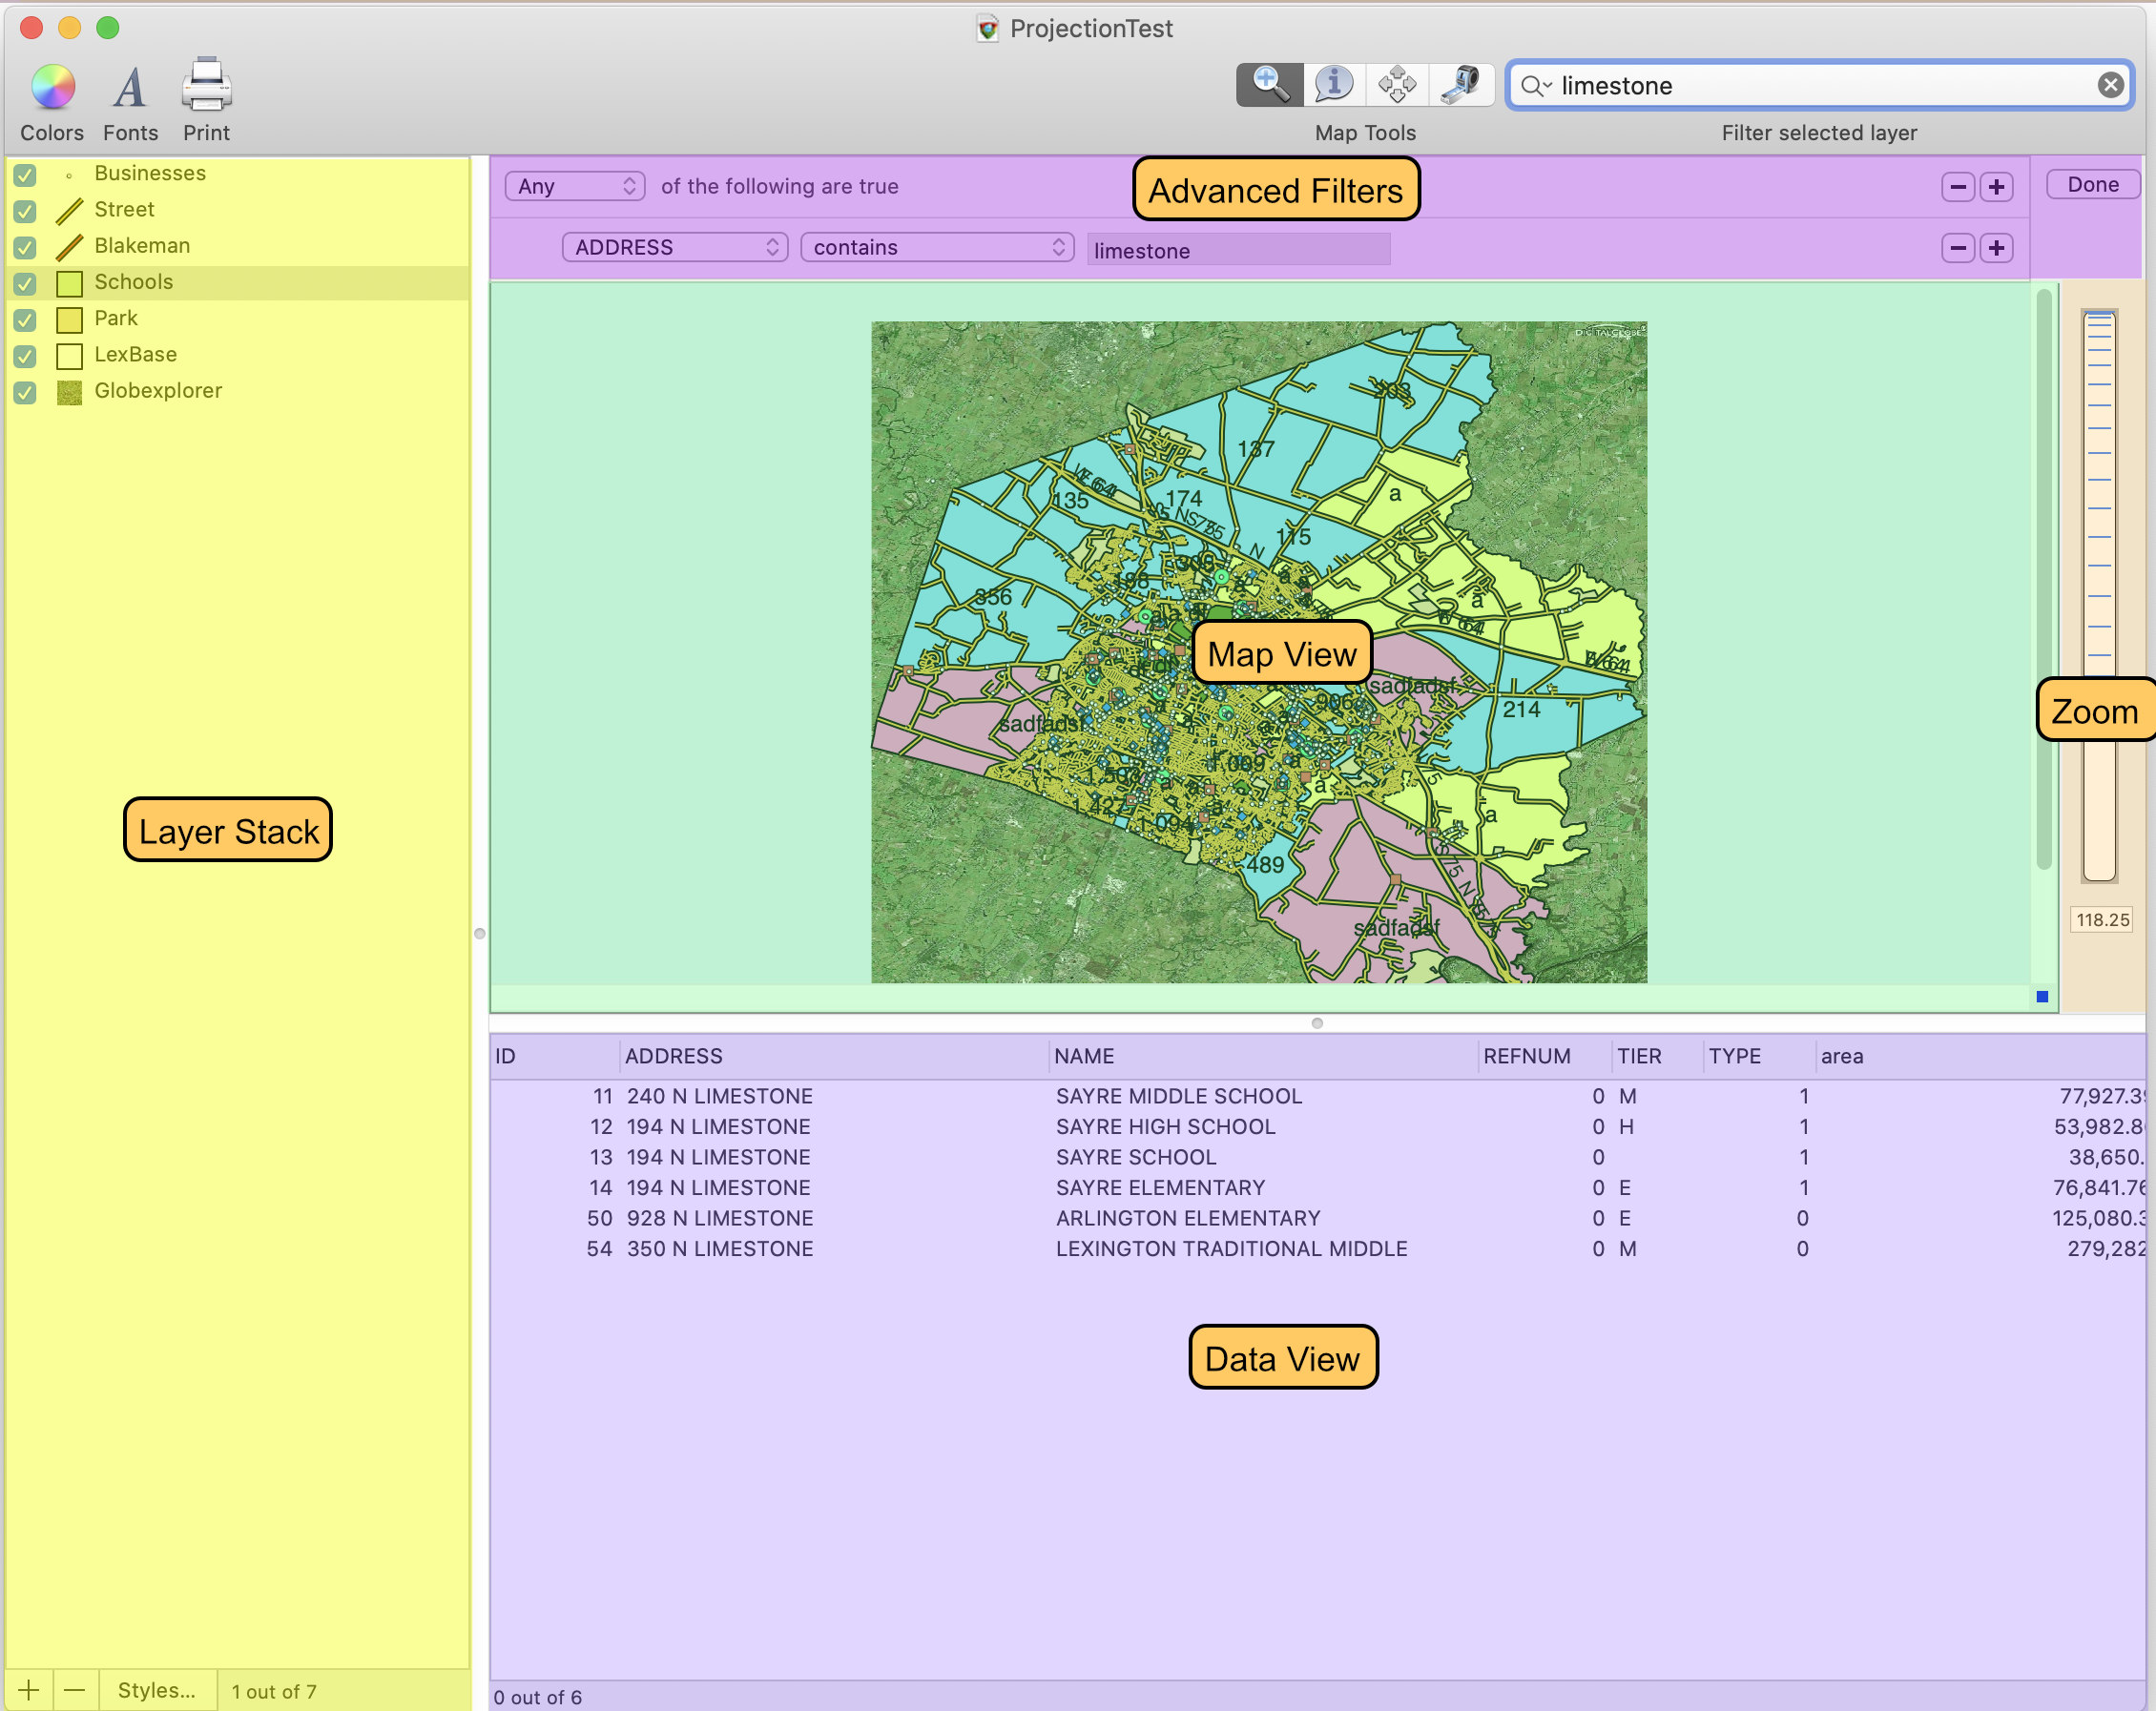
- Toolbar
The Toolbar at the top of the window provides access to often-used functions in Cartographica.
As with all toolbars on the Macintosh, it is optional and may be hidden, resized, or changed by using the Toolbar Button in the upper right corner of the window or >
- Layer Stack
The layer stack shows the list of all layers in the map document and provides an easy way to re-order layers, change styles, and show or hide individual layers.
The selection in the Layer Stack provides guidance to the Map View and Data View as to which data is selectable.
- Map View
The powerhouse of Cartographica, the Map View shows your geospatial data in context with all of the visible layers.
- Data View
The Data View is used to show and edit data for the vector layer selected in the Layer Stack.
- Zoom
The Zoom area is used to control and display zoom information about the Map View. The Zoom Dial can be used like a slider to zoom out (slide up) or zoom in (slide down). Below the Zoom Dial is the Zoom Factor Box which shows the percentage zoom in effect right now. Typing a new value in this box will change the zoom level directly.
- Advanced Filters
The Advanced Filters area is not always visible, but once you have started performing a filter operation (using the Filter box in the Toolbar), it will pop into view. Advanced filters provides for boolean operations so that you can search and filter on more than one variable at a time.
![[Note]](Graphics/note.svg)
Cartographica uses Utility Windows (sometimes called palettes) that float above other windows in order to provide access to more information about the current context. The content of these windows is synchronized to the current Map Window, so if you have more than one Map open, they will change when you switch back and forth between the Map Windows. Each of the Utility Windows is accessible via the menu.
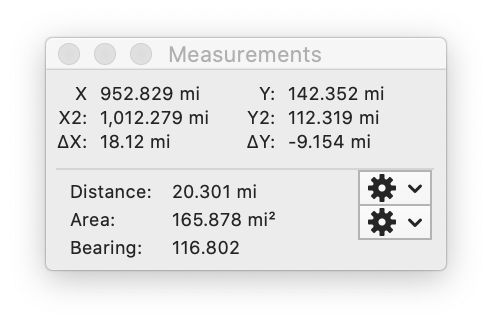
- Measurements
The Measurements Window provides information about the position directly underneath the cursor or the current selection when dragging. See Section 4.5, “Measuring Distance and Area” for details on how to bring up and use the Measurement window.
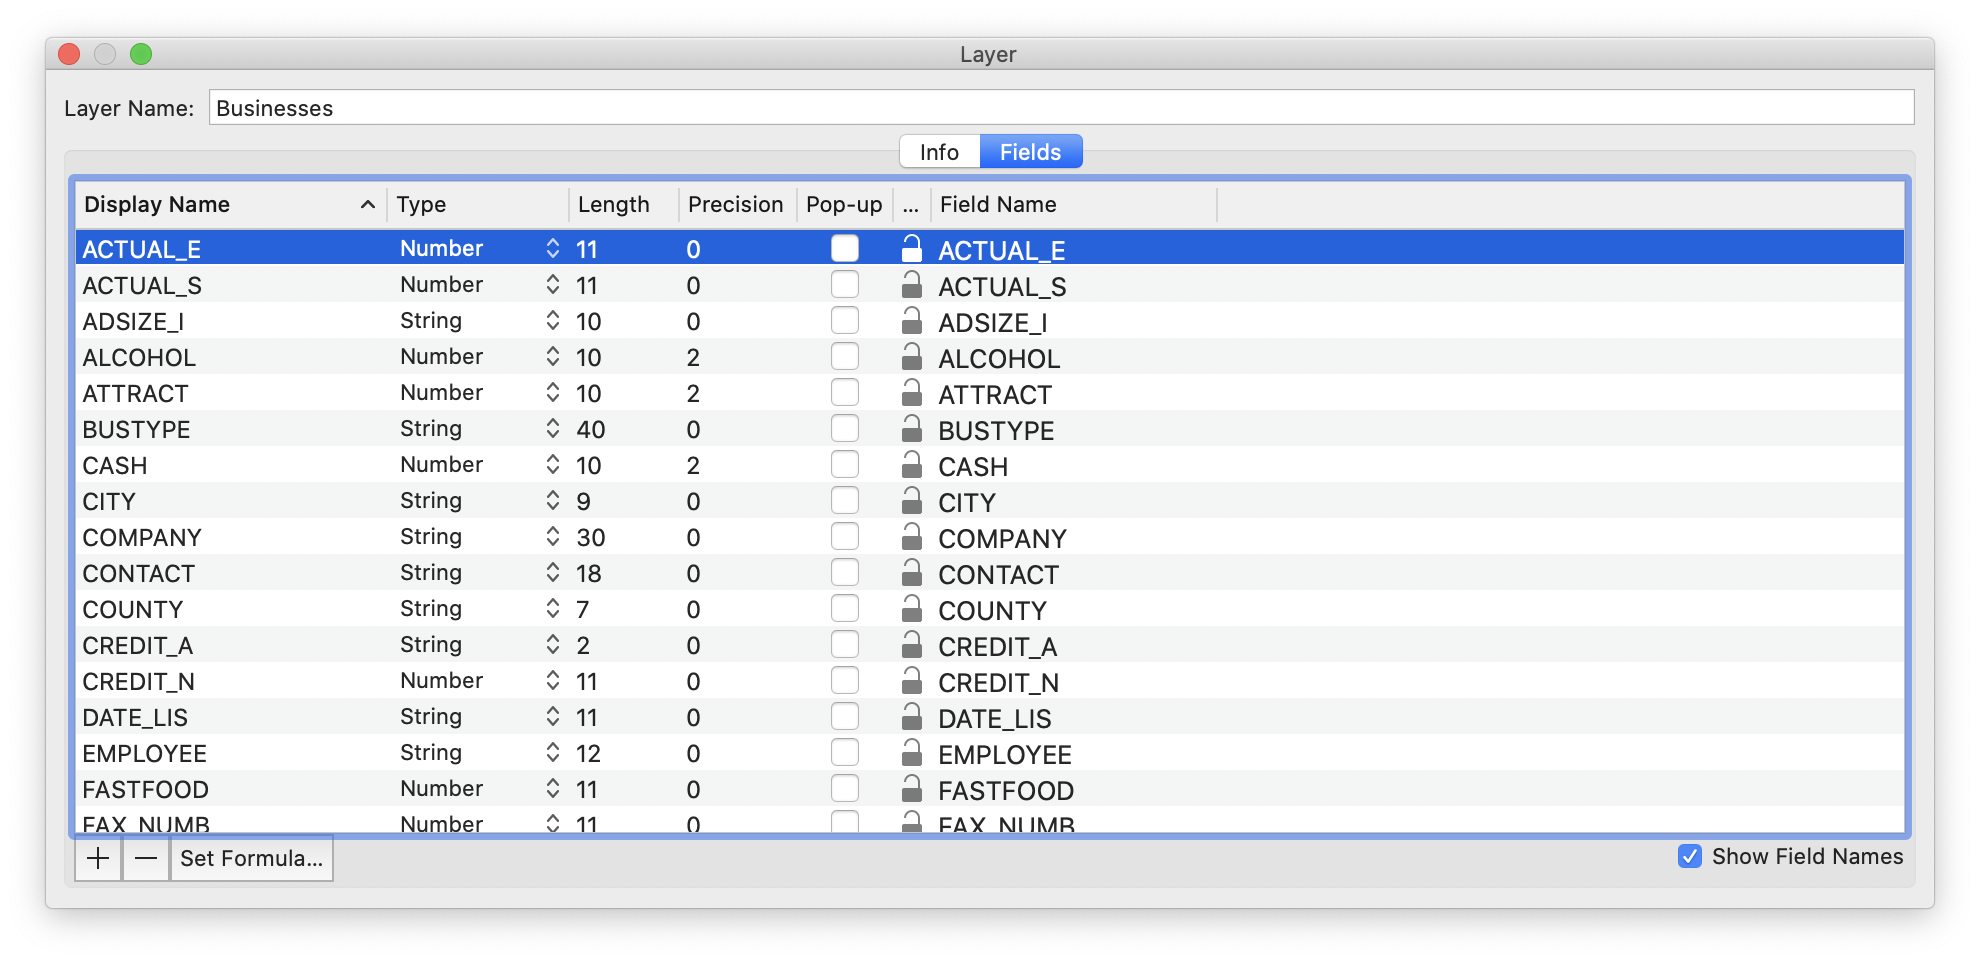
- Layer Info
The Layer Info Window provides information about the layer currently selected in the Layer Stack. Changes made in this window affect the data in the selected layer.
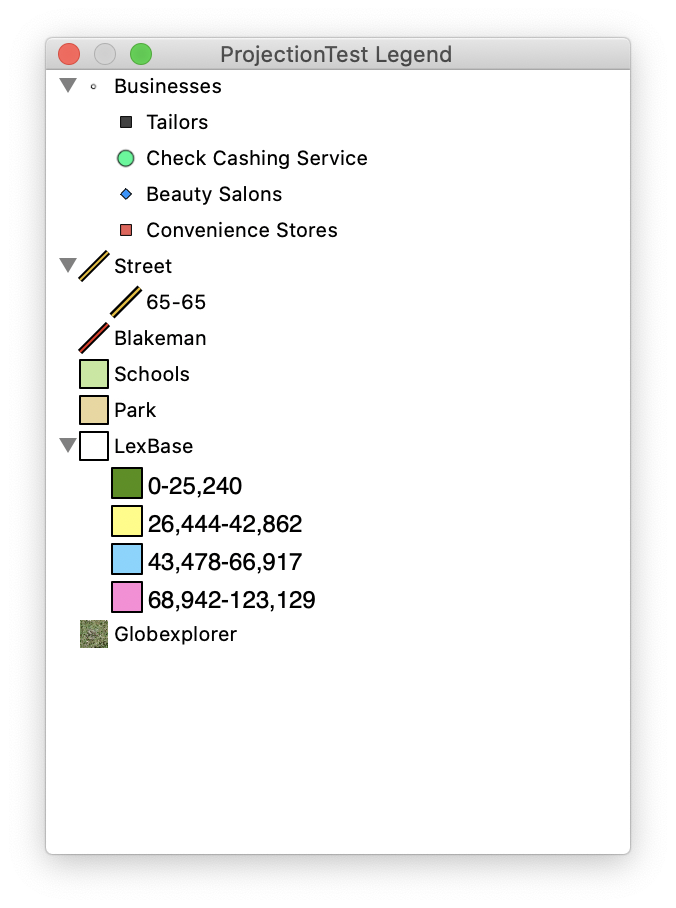
- Legend
The Legend Window provides a quick reference to all of the layer styles in the current Map.
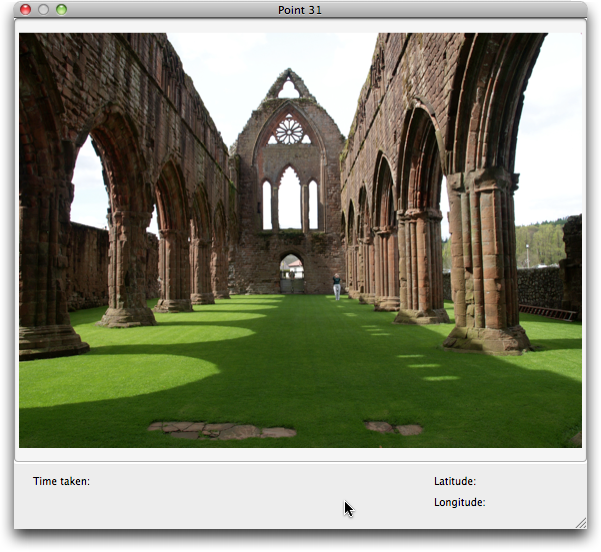
- Image Viewer
The Image Viewer Window provides an enhanced view of any pictures referenced by a feature using the Picture item in the Style window.
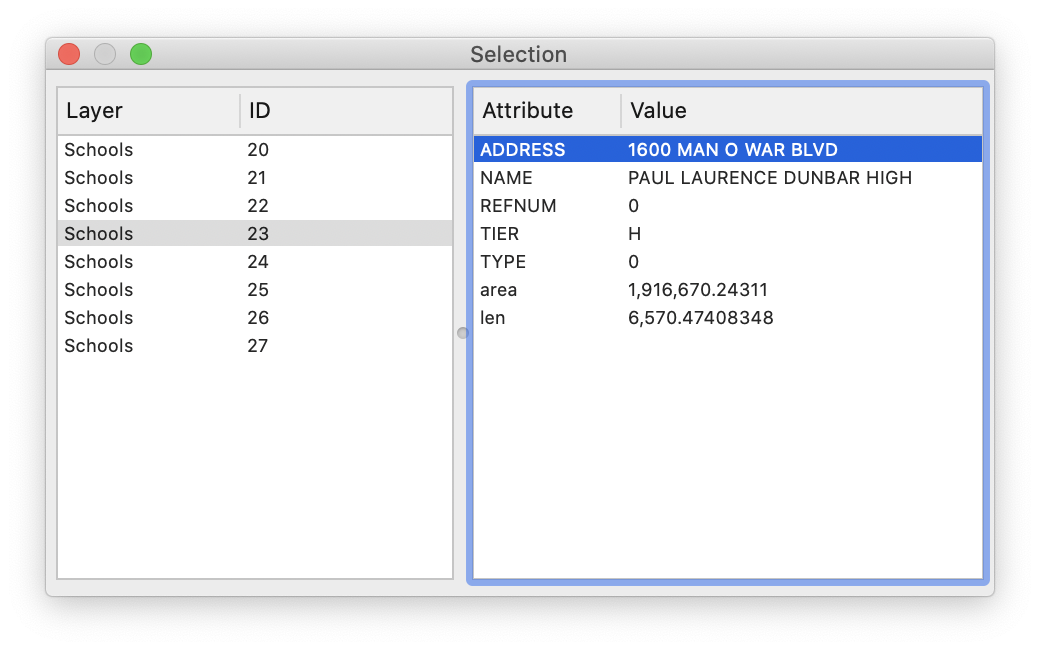
- Selection Info
The Selection Info Window provides a concise view of all selected objects. On the left is a list of all features currently selected and the layer that they belong to. On the right is the information about the selected feature.
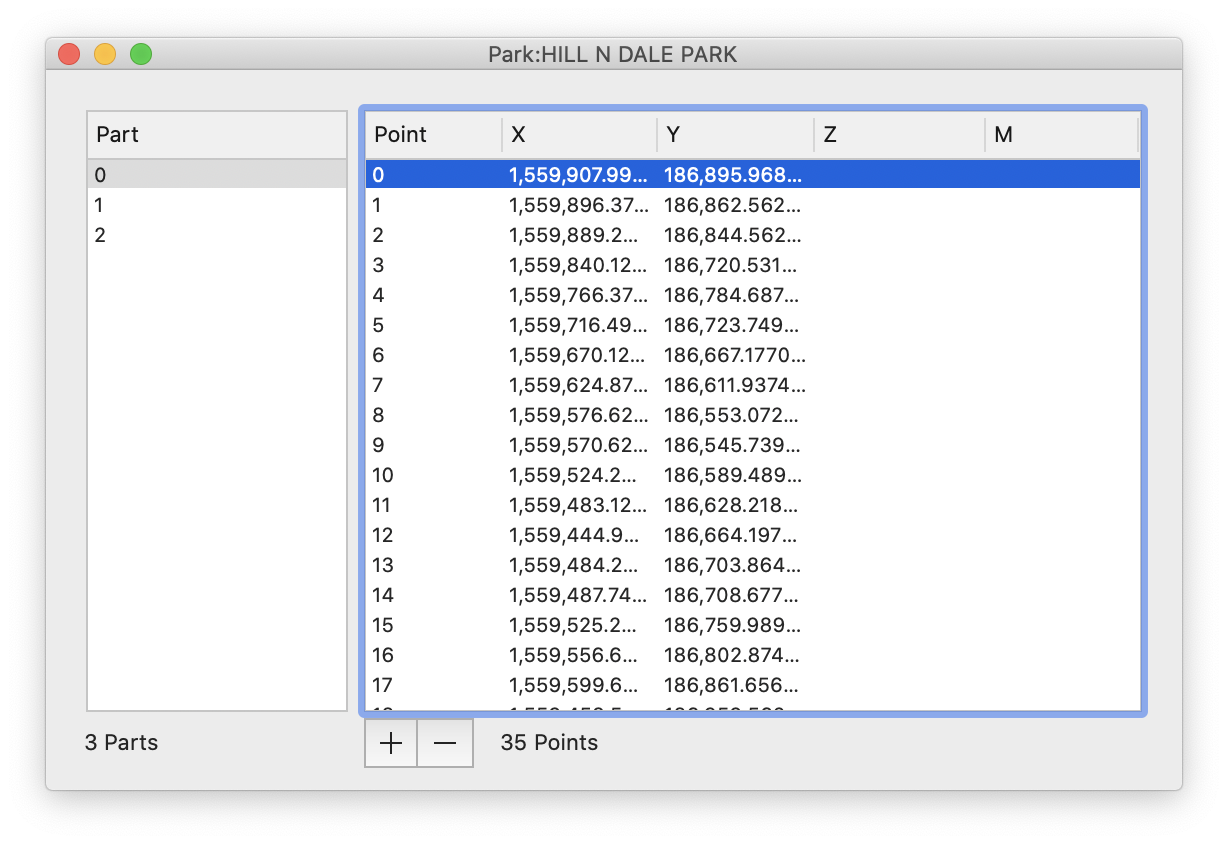
- Point Data
The Point Data Window provides a detailed of all points in geometry of the selected feature. On the left is a list of all parts (all geometries have at least one part if they have any points). On the right is a list of all points in that part. Point information may be edited manually in this window. It is important to remember that all coordinates in this window are in the layer's coordinate system, not in the map's coordinate system.
- Selection Summary
The Selection Summary Window provides a statistical summary of a single column of the selected objects. The Column drop-down determines which column's data is summarized for the selection.