When analyzing digital elevation data, it is frequently useful to be able to take elevation or height data from a raster source and create a vector representation of that for further analysis. In Cartographica, this is done using the Create Contours command.
Creating Contours from DEM
Select the DEM layer (or layers) from the Layer Stack
Choose >
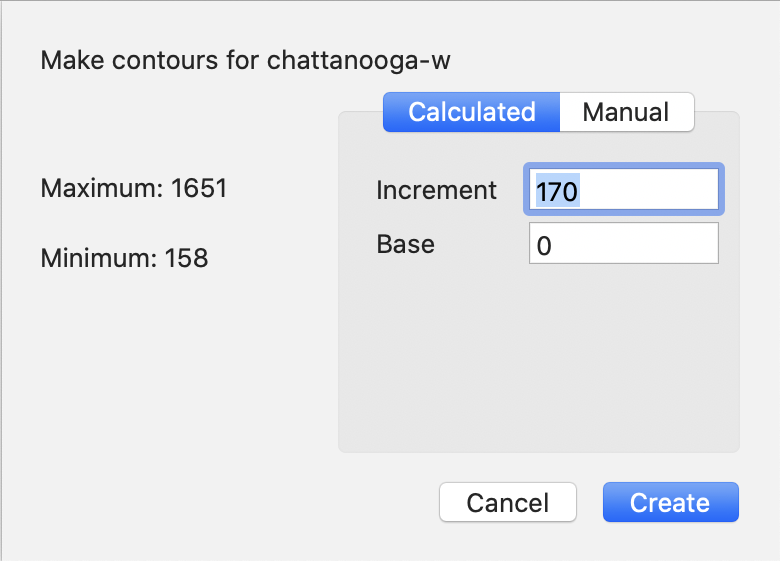
The Create Contours sheet will be displayed, showing the maximum and minimum heights on the left side, and providing two ways to create the contour levels on the right side.
For automatically calculated contours, enter your desired lowest contour in the Base field and the increments at which you want to space the contours in the Increment field. In the example above, the base of 0 and Increment of 170 will result in 10 contour lines at 0, 170, 340, 510, 680, 850, 1020, 1190, 1460, and 1630. Items above 1630 will be in the 1630 contour (since the range of this data is 158-1651).
To manually choose the contour levels, click and then use the and buttons to add and remove contour levels
Click to run the contour analysis
A new layer named with the name of the layer and Contours appended will be added to the Layer Stack