Most GIS data has geospatial information in the form of features (points, lines, and polygons) and non-geospatial data, which may consist of just about anything you can imagine: place names, number of crimes in an area, type of pavement on road. This data is sometimes displayed on the map as labels, represented by colors, or visualized in other ways.
The data view is located at the bottom of the main Cartographica window. This is a standard Mac OS X table, and works the same as other tables on the platform.
The layer that is shown in the data view is the layer that is currently selected in the layer stack. If you are looking at the screen and wondering why the data you're looking for is not what you expect, check the layer stack and make sure the layer you are interested in is selected. If you have more than one layer selected in the layer stack, no data will be shown in the data view.
Further, the selection in the data view is synchronized with the selection in the map view, which means that if you select a feature in the map view, the data view will scroll such that the information about that feature is visible. Similarly, if you click on a row (or rows) in the data view, the corresponding map view features will be selected.
Sorting the Data View
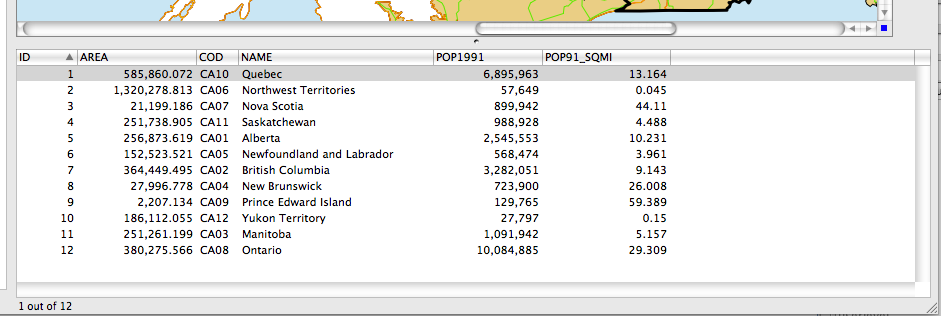
Click on the heading for the column on which you would sort the view
The table will sort to your specifications and an arrow will be displayed at the right side of the header to indicate the sort order.
To sort in the opposite order on the same column, just click again in the column heading.
Re-ordering columns in the Data View
Click on the column heading and drag it to the new location
The column will move from its old location to the new location
Editing data in the Data View
Editing most of this data is very straightforward as it is done directly in the data table below the main Map in the Map Window. Once you have a layer selected, click on the individual cell of data and start typing.
Select a single layer in the layer stack
Cartographica will display the data for this layer in the data view
Select a feature:
Click on a feature in the map
Click on a row in the table
The feature will be selected in both the map and the Data View.
Click in the column to change
The blue focus box will show up around the table cell indicating that you may now enter your data
![[Note]](Graphics/note.svg)
Columns which have been locked or which contain Column Formulas cannot be edited and will not enable when clicked.
Press the enter key to finish editing
Locating the selected data on the map
There are times, especially when working with the Data View that you can't easily locate the data you have selected on the map. Cartographica has a couple of different ways to view these.
Select the item that you want to locate on the map using the Data View
Locate the feature corresponding to the row:
Tap and hold the space bar
The selected feature(s) will appear zoomed out to the full size of the Map View. When the space bar is released, the feature will recede slowly into its position on the map. This is most useful when you just want to locate, but not move the focus of the map
Choose >
The Map View will be zoomed to an area encompassing the selected feature(s). This is most useful when you are interested in seeing the detail of a feature.
Click on the heading for the column on which you would sort the view
The table will sort to your specifications and an arrow will be displayed at the right side of the header to indicate the sort order.
To sort in the opposite order on the same column, just click again in the column heading.