Importing files containing coordinate data
Choose > .
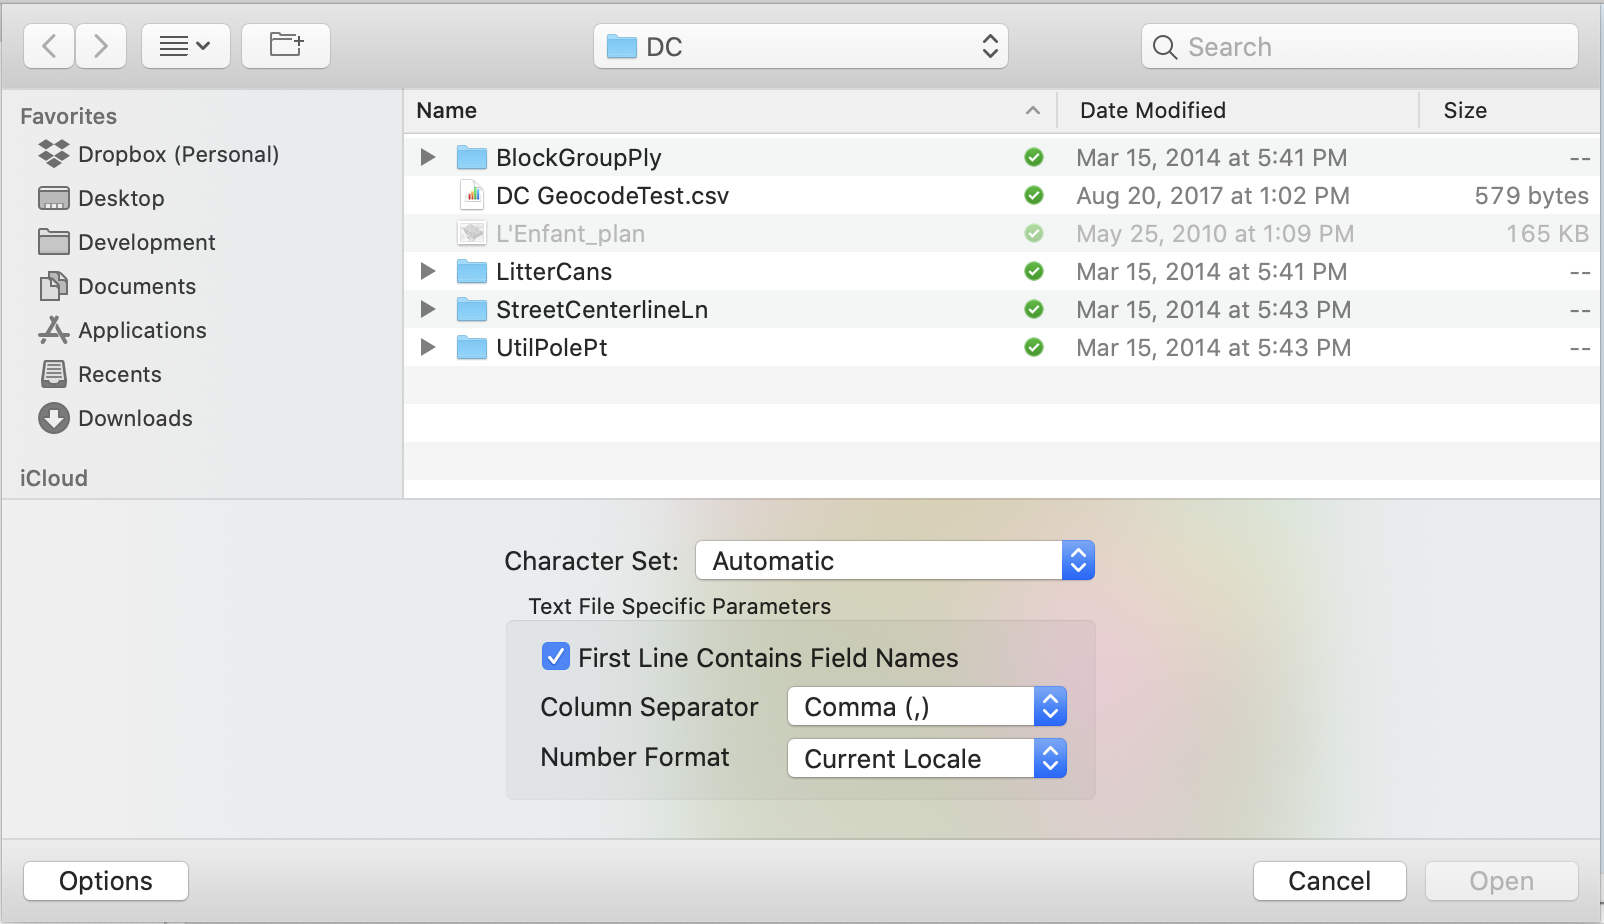
The import table file chooser appears.
This chooser is a standard file chooser with a few additional options to control how the text is interpreted. The character set may be chosen, overriding the default character set in the file. For text files, you may also tell Cartographica to consider the first line of the file to contain field names (the default), and designate the column separator and number format.
Select the location of the text or table file you want to import and click .
The Import Map window appears and describes the format of the file and requests that you determine how it should interpret the data as it is read.
Using select an existing layer to append the data to, or choose .
Choose Coordinates from the right hand set of tabs in the window. This will enable coordinate import mode.
Because you are in coordinate import mode, the choices in your Map To column include , and along with the standard options of , , and any columns that exist in your selected target layer.
Using the Import Map (as described in Section 3.4.1, “The Import Map”, map the incoming data fields to your selected layer, making sure that you map at least one column to the X and Y coordinates. Without both of these, Cartographica cannot place the data on the map.
Click to import your data into the map.
Cartographica will read the data from the file, interpret the columns to the best of its abilities and store them into the requested layer.
Once you have imported the data, choose > to confirm that the coordinate system of the data is accurately represented.
Importing files containing address data
Before importing address data, the geocoder must be appropriately configured. This is an easy process, outlined in Section 8.7, “Geocoding Addresses”.
Choose > .
The import table file chooser appears.
Select the location of the text or table file you want to import and click .
The Import Map window appears and describes the format of the file and requests that you determine how it should interpret the data as it is read.
Using select an existing layer to append the data to, or choose .
Choose Geocode from the right hand set of tabs in the window. This will enable address geocoding mode.
Because you are in address geocoding mode, the choices in your Map To column include through , , , , and along with the standard options of , , and any columns that exist in your selected target layer.
Check the box if you want Cartographica to include additional diagnostic and position information obtained through geocoding
Using the Import Map (as described in Section 3.4.1, “The Import Map”, map the incoming data fields to your selected layer, making sure that you map at least one column to . If it is the only column specified, then it will be presumed to have a full address in it.
If necessary, fill in one or more of the City, State, or Country boxes in the right pane. These act as defaults for the geocoder in the event that there are no columns that match. Often city data is delivered with only the street portion of the address, and these fields can be used to limit the search to that particular city.
Click to import your data into the map.
Cartographica will read the data from the file, interpret the columns to the best of its abilities using the geocoding specifications and store them into the requested layer.
Once you have imported the data, choose > to confirm that the coordinate system of the data is accurately represented.