You can change the projection in the map window. This doesn't change the underlying data in any layer, it just coerces the data into that projection for display and output purposes. Any change you make here affects all of the Layers in the map and will persist until the change is made again using the same method.
The projection of a map is a way of representing map data on a plane (a "flat" map) either on screen or on paper. All map projections distort the surface in some way. Depending on the purpose of the map, some distortions are acceptable and others are not; therefore different map projections exist in order to preserve some properties of the original shape in the flat map representation. You can choose from different projections to see which more accurately represent your data and which compromises are most acceptable to you. You decide what the projection will be. Some representations of projections include the United Kingdom using the British Grid or Equal Area Projections giving maps of the United States that "curved" look or even using different map projections to give a 3D look to a map like you might see on a GPS display.
To change the target projection of a map:
> .
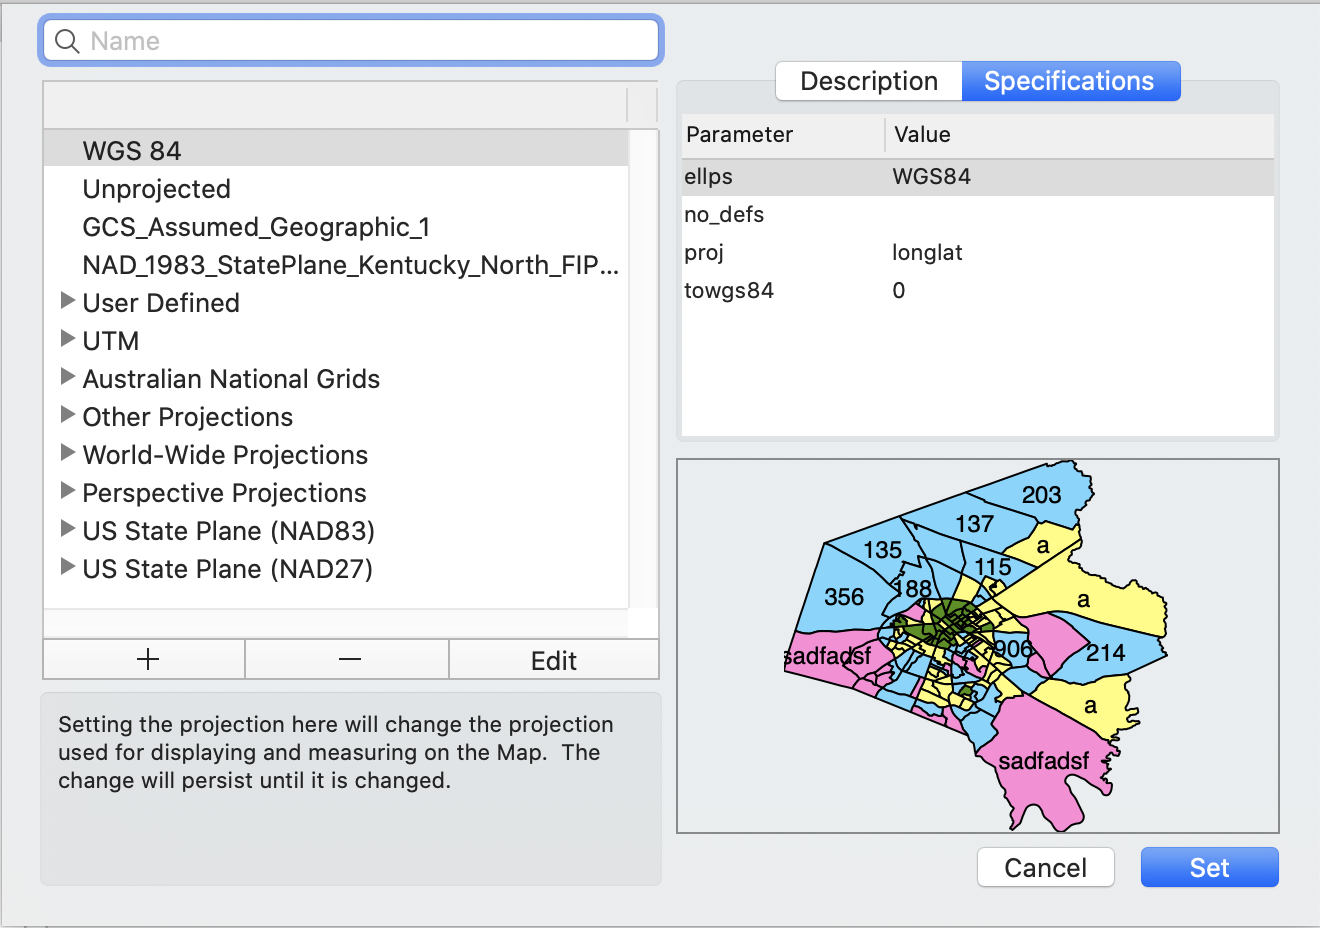
The Project Map dialog appears.
From the left side of the dialog, choose the map projection that best suits your needs.
The Description box on the right will change depending which projection is selected. You can also click the Specifications tab to see additional details about the selected projection.
Below this informational area there is a small preview are that gives a general orientation for the features of your map once the selected projection has been confirmed.
You can use the search/filter box to find a particular projection (or group of projections) and narrow down your choices. As you type in the search box, the projections that do not match the search criteria are automatically removed, creating a smaller list from which to choose.
Once you have the selected the projection that best suits your needs and most accurately represents the data you are attempting to display, click .